Webhook Success Key #5: Know How to Debug Your Webhooks
John E. Huschka, January 25, 2018
Azure Functions — Internet cloud based custom code for SharePoint and Office 365.
SharePoint Webhooks — Connections that allow us to attach custom code to SharePoint that is called when events occur.
This post is part of our blog series and demonstration code on achieving webhook success.
If you implement your Azure-based webhook as a compiled .NET solution, it is tricky to debug it within Visual Studio. Here are the steps, illustrated using Visual Studio 2017.
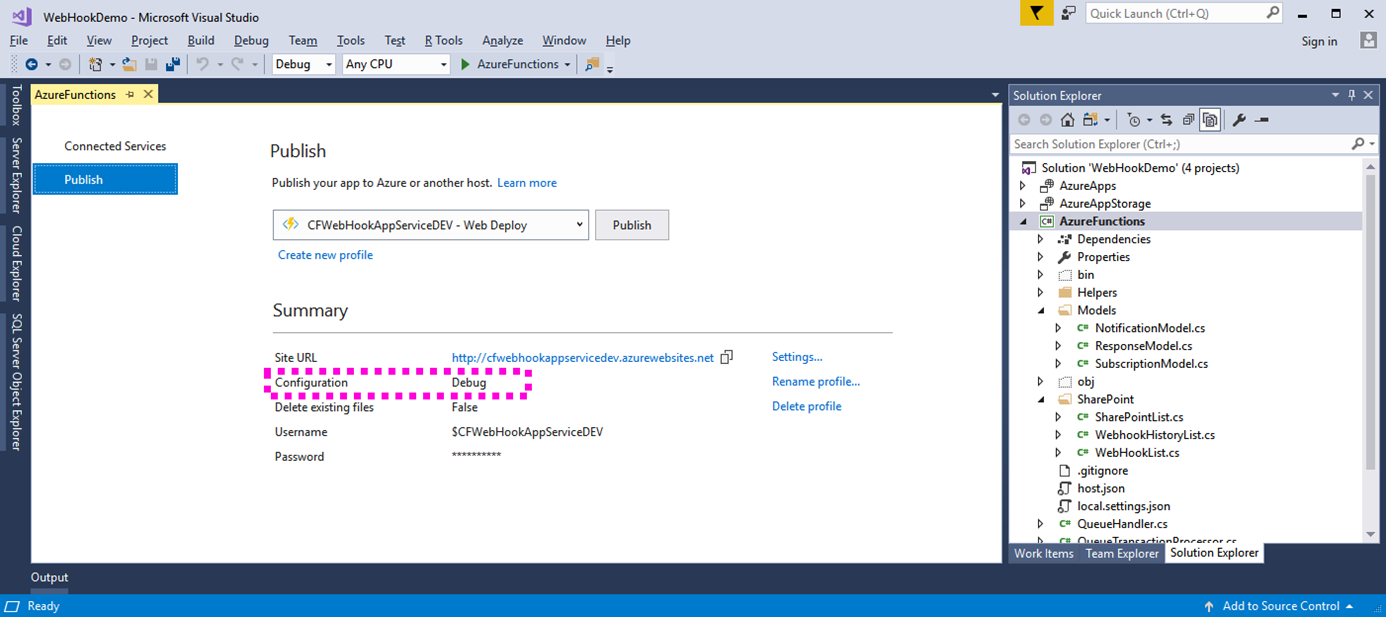
The first step is to make sure that you have deployed a build of your code in debug configuration. If you are publishing from Visual Studio, you can select the “Debug” configuration when you publish:
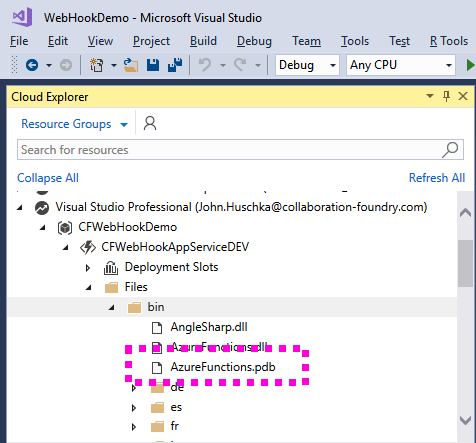
If you have a debug-able build deployed to Azure, you should see the debug symbol file(s) available in Azure. You can see this within Visual Studio’s Cloud Explorer:
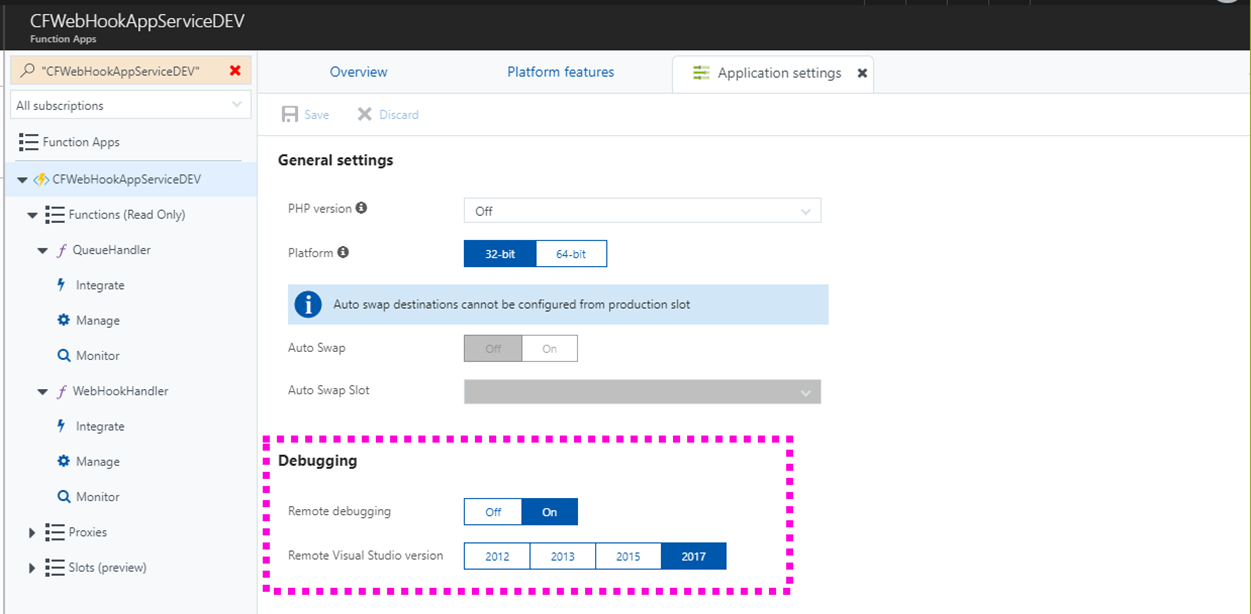
In addition, you must enable debugging for the Azure App Service within Azure. You can do this from the Azure portal, within the “Application Settings” for the App Service:
Note: If you are using Azure Government, as of this writing, no managment user interface is provided for App Services. You must manage it through other tools/techniques, such as this REST Update Configuration API.
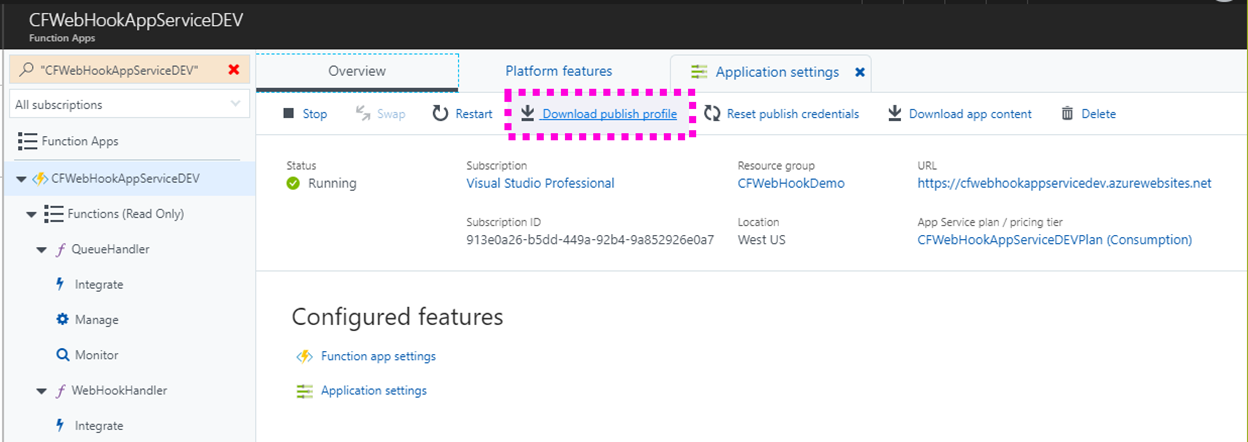
To debug the function, Visual Studio will need to connect to the Azure App Service. To do this, you will need the credentials for the App Service. An effective way to do this is to use the App Service Portal's “Download publish profile” button:
When you click on the button, you will download a file that contains the required credentials:

Finally, you start debugging in Visual Studio from the Debug/Attach to Process menu. Enter the App Service’s URL (no protocol prefix), followed by ":4022" into the Connection Target field and press the Enter key. You will be prompted for the App Service credentials.
Key (or copy/paste) the user name from the publish profile, prefixed with a period and a backslash (“.\”) and then key the password. Your window will appear like this:
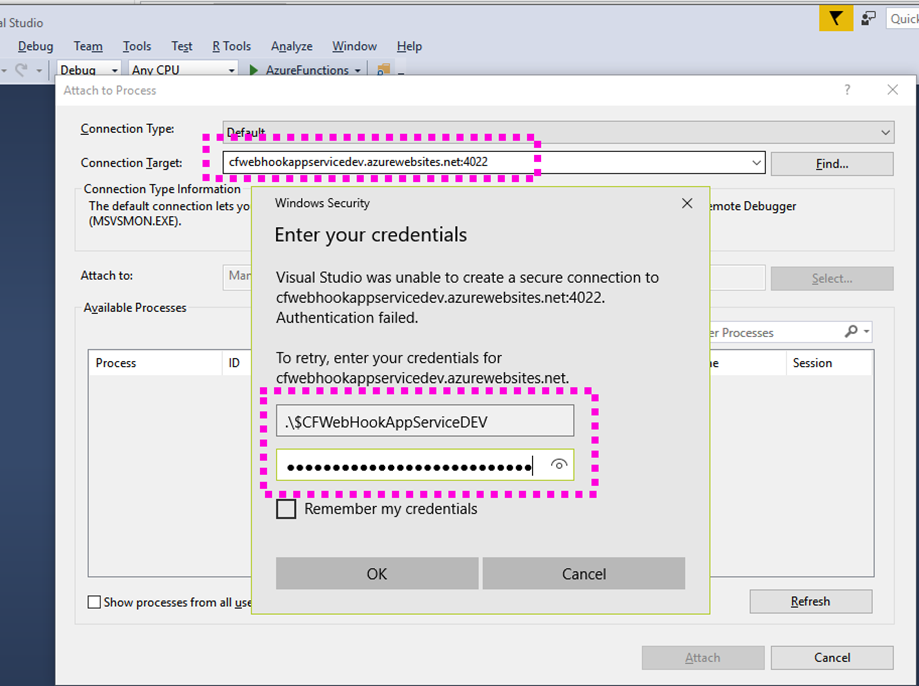
Note: We rarely "Remember credentials" because it is easy to mis-enter them and end up with them remembered incorrectly.
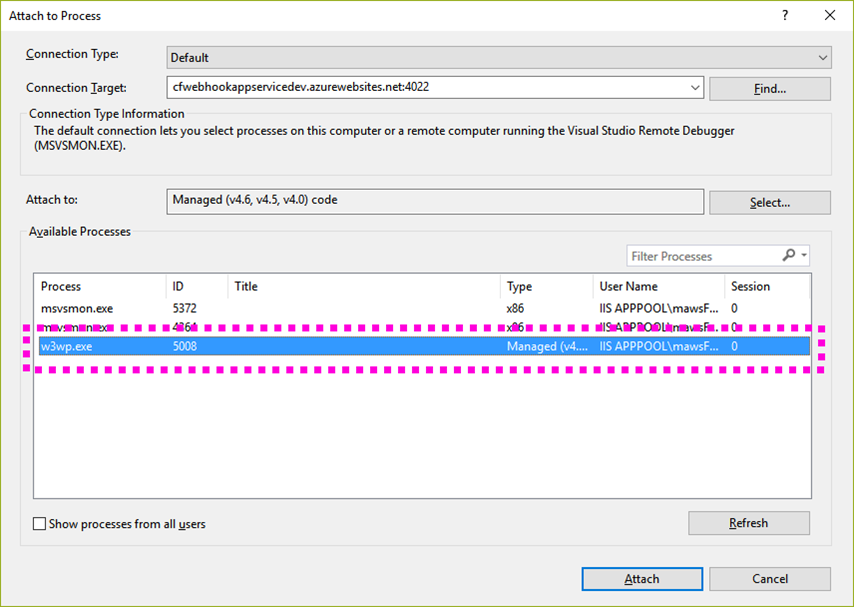
Once you have connected to the App Service endpoint, you will see the the list of processes available to you for debugging. You should be able to attach to the worker process (w3wp.exe):
Now, as long as you remain attached, you will be able to debug in Visual Studio as normal the next time SharePoint triggers the webhook:
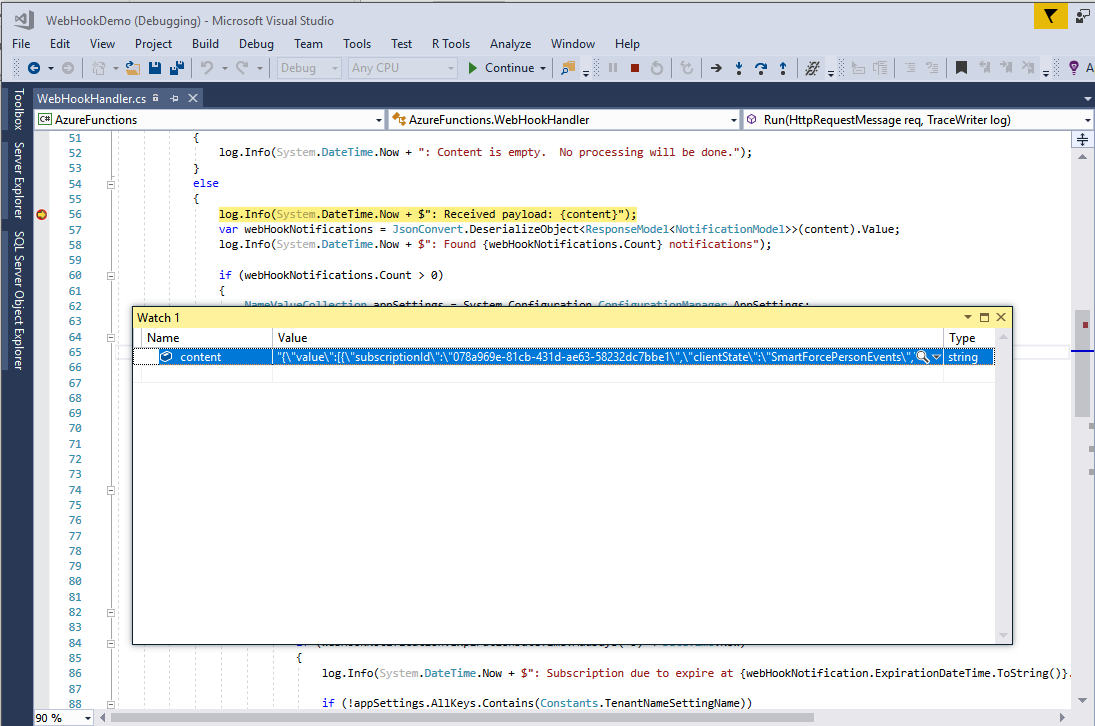
Visual Studio provides you with powerful debugging capabilities, even to the Azure cloud. Proper use can give you tremendous visibility into your webhook, allowing you to quickly solve problems.
More in our "Webhook Success Keys" series:
We at Collaboration Foundry are experts in SharePoint and Office 365. If you need assistance, we can help.
Contact us.
Also, don't forget to take a look at our
blog for more helpful tips and techniques.